
Integrated Analytics
Improve study success with early observations of
aggregated data across studies and programs
Improve study success with early observations of
aggregated data across studies and programs
Prevail’s innovative analytics provide timely, data-driven insights into live studies, regardless of protocol, data, and system complexity – all without breaking the blind. With advanced visibility into aggregated clinical and operational data at their fingertips, sponsors are making faster and more informed decisions to achieve their study endpoints, enhance patient safety, and reduce risk.
Deployed as Software-as-a-Service, Prevail Integrated Analytics can be implemented in just 4-7 weeks, even in studies already underway – and is often up and running in just 15 days. All clinical, operational, diagnostic, and accounting data is automatically and continually integrated into a central repository for rapid and comprehensive analysis – from any source or system.
Prevail’s unique ability to provide a unified view of a study encompassing all clinical and operational data sources has helped customers reduce development timelines by months, and study costs by millions of dollars.

Always have your finger on the pulse of enrollment and study progress. Never again have different databases with different patient counts. What does your current enrollment rate mean for LPV? What does your current CRF lock % mean for database lock timelines?

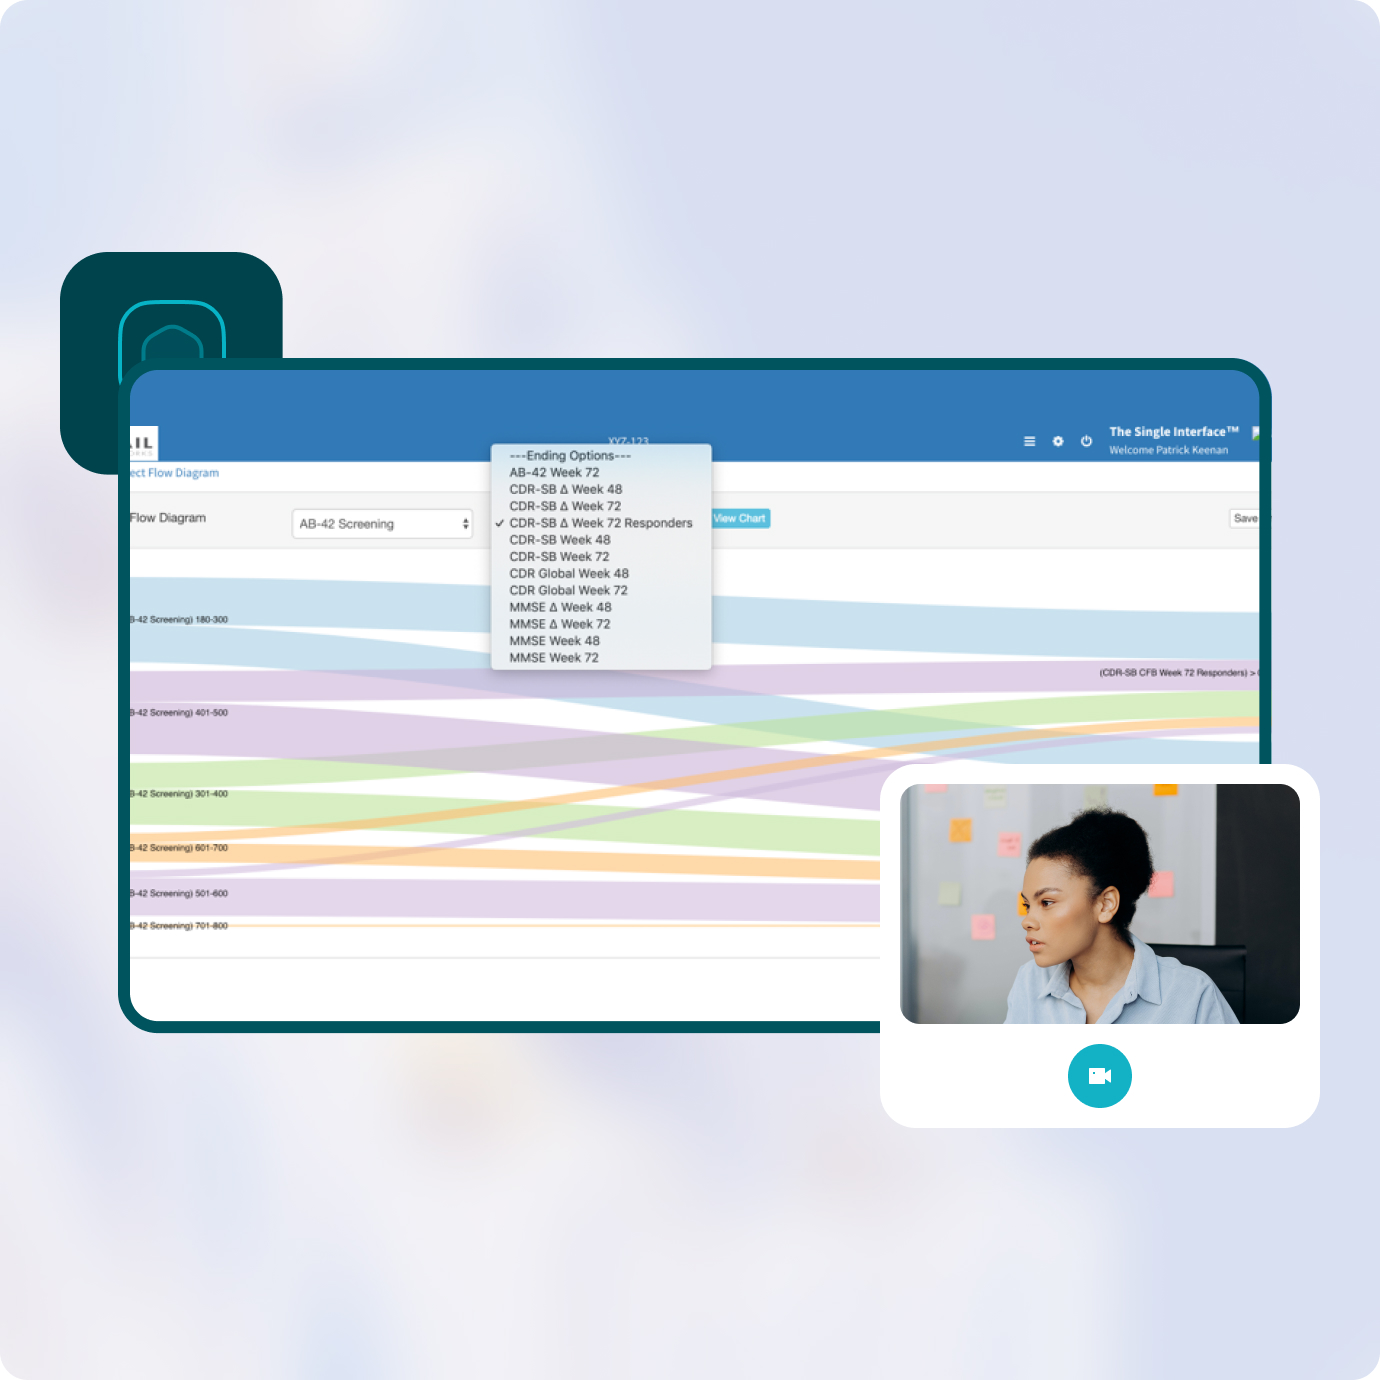
Prevail’s Dynamic Graph Viewer allows even novice users create powerful visualizations and reporting engines that are tailored to their specific needs.

Line graphs, scatter-plots and bar-charts are only useful if you can turn that realization into action. With Prevail, simply hovering-over a data point, line or bar will take you to the information you need to enact change.

Having an easy-to-use system with endless ways of analyzing and visually displaying your aggregated data in real-time helps uncover hidden trends and correlations that might have stayed otherwise obscured.

Whether you have hundreds of sites with several degrees of separation or a particular geography of concern, metrics that track quality and detect fraud are invaluable to maintaining the integrity of a clinical study.

Inclusion/exclusion criteria covers all types of data so only an integrated database can make sure you are enrolling the right patients. Catching ineligible patients can save a study with tight statistical powering and/or drug supply.

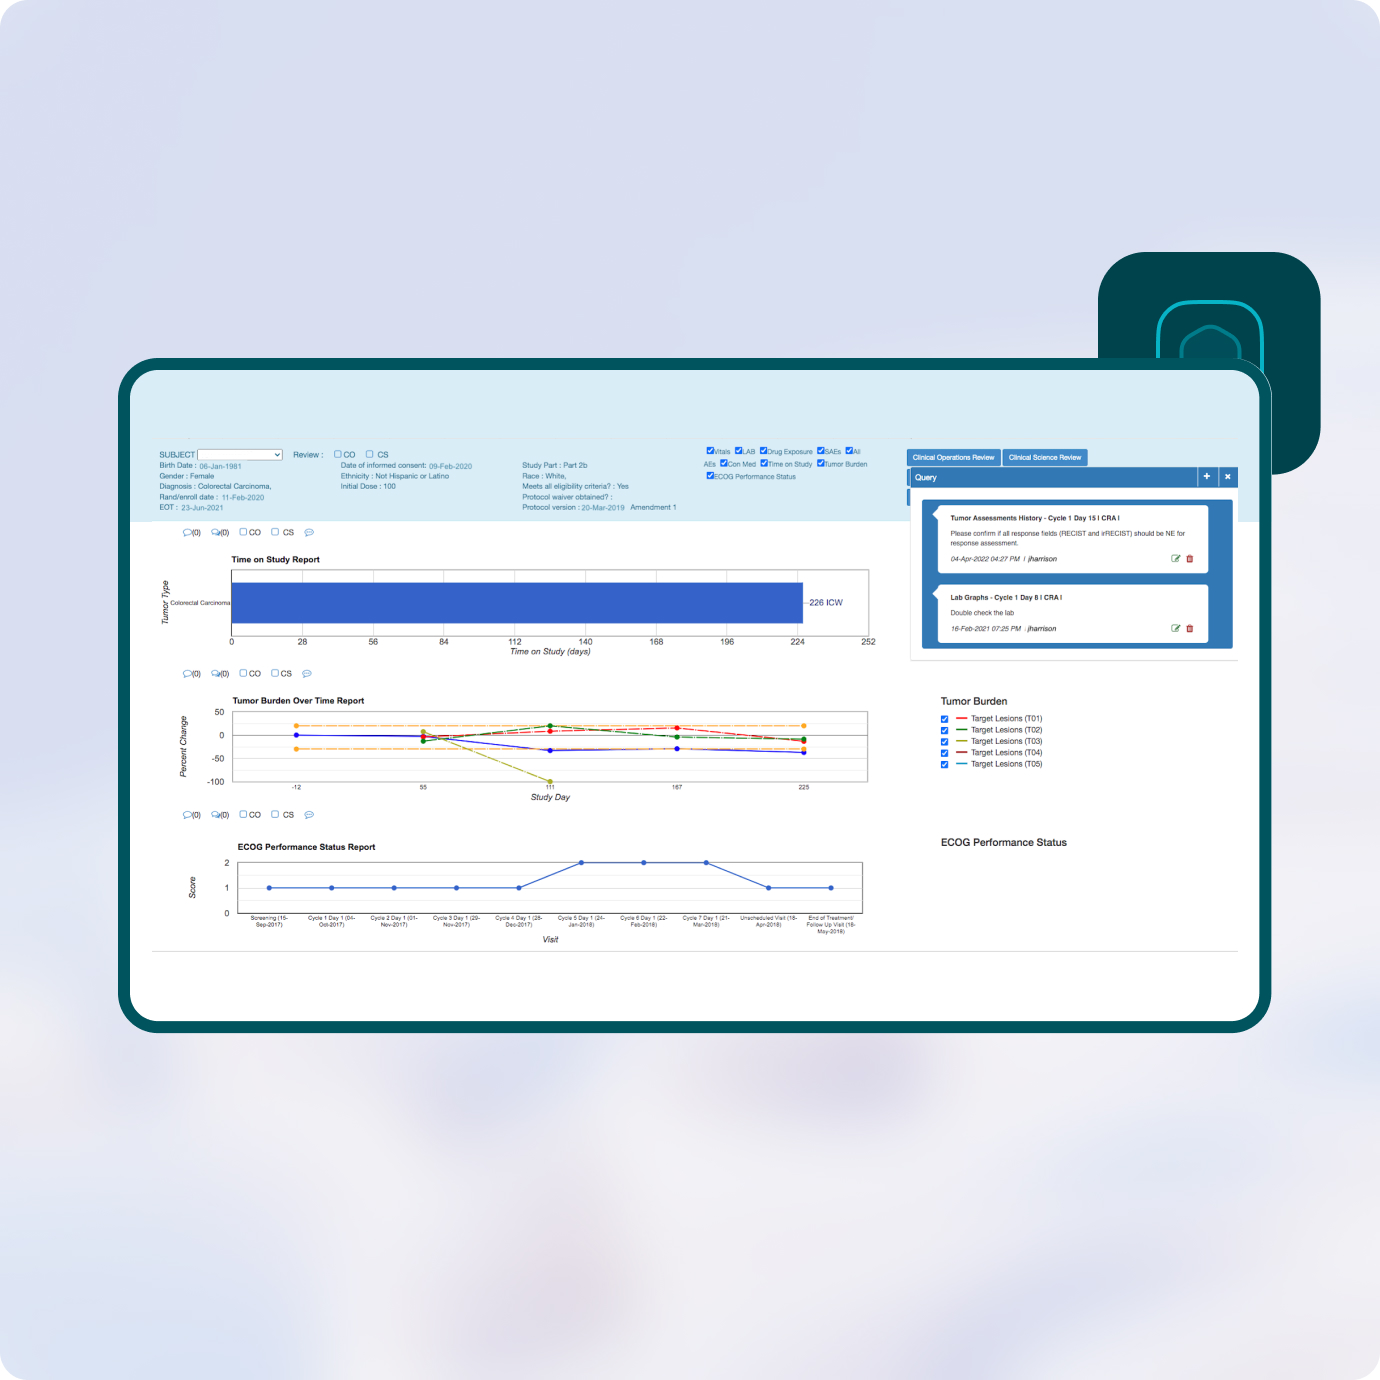
Save your medical team countless hours by giving them on-tap patient profiles that display the relevant data from multiple sources in one report of easy-to-read visualization and charts. Review concomitant meds alongside Adverse Events.

Whether its Kaplan-Meier Survival Analysis in Oncology, or Rater Consistency Analysis in CNS or eye-specific analyses in Ophthalmology, each therapeutic areas requires customized reporting which Prevail can draw from its extensive libraries.


Learn how Prevail’s Integrated Analytics can help make your study a success.

Ready to see how Prevail’s integrated analytics can help you improve clinical development and achieve better outcomes?